Life with diabetes is filled with numbers: blood sugar values, insulin units, carbohydrate grams, carbohydrate to insulin ratio, basal rates, and the list could go on and on, but 2 numbers especially important to understand in terms of overall blood sugar management are Hemoglobin A1C and Time in Range.
The Hemoglobin A1C test is a blood test used to diagnose prediabetes, type 1 diabetes, or type 2 diabetes and also assess blood glucose management in monitoring a diabetes treatment plan [2] by providing a 2-3 month average blood sugar. While it was first discovered in 1968 that those with diabetes have an elevated hemoglobin A1C, it wasn’t until 1993 that The Diabetes Control and Complications Trial (DCCT) proved that A1C can predict risk for diabetes complications in people with type 1 diabetes.
This led to the development of blood glucose targets, and the recommendation was provided for A1C to be less than 7% to keep risk for complications very low. A few years later, the United Kingdom Prospective Diabetes Study proved that A1C can also predict complications in people with type 2 diabetes leading to the hemoglobin A1C test being considered the gold standard in assessing blood glucose management [1].
Before we get into time in range, let’s start with a deep dive into A1C.
***The information in this post is meant to be informational and not meant to provide medical advice or replace a doctor and/or medical care team’s guidance on how you should handle and manage your diabetes. Always consult with your doctor and diabetes care team on what is best for your diabetes management.
Hemoglobin A1C
To fully understand how the hemoglobin A1C (HbA1c) test is able to provide an average blood sugar, you first must understand what hemoglobin is.
Keep it Simple for me! Explanation: Hemoglobin is a protein in red blood cells that transports oxygen from the lungs to the body tissues. Glucose also attaches to hemoglobin when it enters the blood stream. When hemoglobin is continually in the presence of elevated glucose levels, the glucose permanently attaches and causes the hemoglobin to become sugar coated. The hemoglobin A1C test is a measurement of the sugar coated hemoglobin. The life span of a hemoglobin protein is about 2-3 months which is why the hemoglobin A1C test provides a 2-3 month average blood sugar value.
Nerd Alert! Explanation: Hemoglobin is a protein in red blood cells that transports oxygen from the lungs to the body tissues. Each hemoglobin protein has openings where the oxygen molecules can latch on for transportation through the blood stream. When glucose enters the blood stream it also attaches to hemoglobin. Everybody has some sugar attached to hemoglobin, but in the case of diabetes where there can be consistently elevated levels of glucose in the blood stream, the glucose permanently latches to the hemoglobin where it then takes up a space meant for oxygen. This permanent attachment forms a chemical link where that hemoglobin is then considered glycated. The hemoglobin A1C test is a measurement of those glycated hemoglobin proteins as the higher the number of glycated hemoglobin, the higher the glucose concentration in the blood stream. The life span of a hemoglobin protein is about 2-3 months which is why the hemoglobin A1C test provides a 2-3 month average blood sugar value.
The Hemoglobin A1C value correlates to an average blood sugar so the “7%” mentioned earlier is an estimated average blood glucose (eAG) of 154 mg/dL or 8.6 mmol/l. Here is a chart showing A1C values and estimated average blood glucose. Fun fact, the “mg/dL” unit of measure is primarily used in the United States where the “mmol/l” unit of measure is most commonly used in all other countries.

So why does a lower A1C matter?
First, your healthcare team and diabetes Provider should help you determine what your A1C goal is as there is no one size fits all target, but the goal for most adults is lower than 7% [3].
Sugar or glucose in excess can block blood vessels, weaken blood vessel walls, interfere with nerve signal transmission, damage nerves, and provide a breeding ground for bacteria. This is why those with diabetes are at increased risk for infections, skin complications, cardiovascular disease, high blood pressure, strokes, neuropathy (nerve damage), nephropathy (kidney disease), and eye complications such as glaucoma, cataracts, and retinopathy [4]. Most simply put, excess sugar in the body causes stress to the body structures and that compounds over time resulting in complications.
Remember the DCCT study mentioned at the beginning that resulted in the development of blood glucose targets? The data from 1441 participants showed that intensive therapy to maintain an A1C of 7% or lower showed a 76% overall reduction in eye disease (retinopathy), 34% less microalbuminuria (kidney disease), 69% less occurrence of nerve disease (neuropathy), and trends towards reduction in risk factors for heart disease. Even those with some signs of complications at the beginning of the study saw 54% less progression in eye disease, 56% less proteinuria, and 57% less occurrence of nerve disease [5]. These percent reductions were in comparison to the group of participants who had an average A1C of 9%. These results show that lowering your A1C by 1 percent can mean a 45% less risk for developing complications of diabetes, and the 45% is for each percent lower the closer to normal (<6%), so even if you have signs of complications, lowering your A1C can stabilize or slow the progression of complications. [5]
A follow up study to the DCCT called the Epidemiology of Diabetes Interventions & Complications (EDIC) followed the same participants from 1993 to 2005 showing that after 11 years with the A1C of both groups averaging to about 8%, there was 75% less progression in retinopathy, 86% risk reduction in onset of new microalbuminuria, and 57% less risk of heart attack, stroke, or cardiovascular death [5]. Working to lower your A1C or maintain an already lower A1C has long term health benefits not matter the starting point. Now let’s move on to time in range.
Time in Range (TIR)
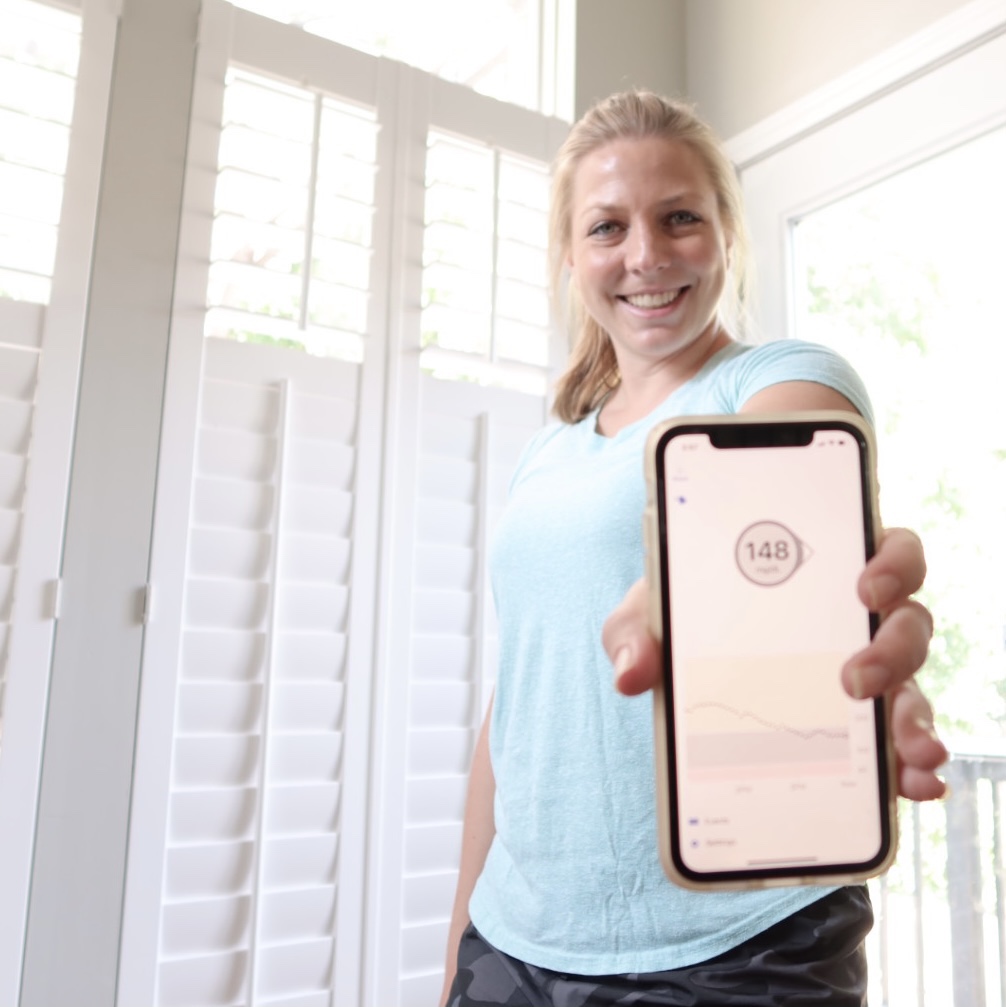
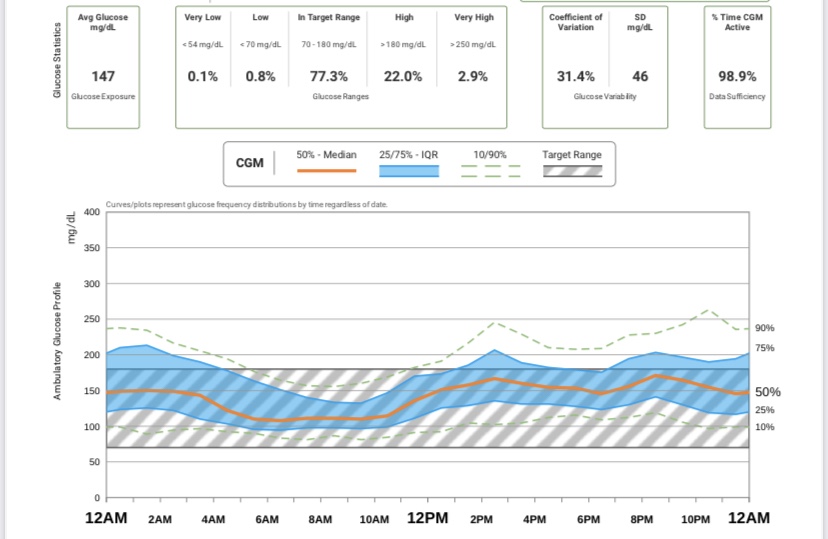
With the A1C test providing an average blood glucose, it misses 2 important pieces in blood sugar management, especially in those with type 1 diabetes, and that is low blood sugar and blood sugar fluctuation or variability. While a person’s A1C may be on target and in an acceptable range, it is unknown whether blood sugar values remain fairly consistent to get this value or could be fluctuating from extreme lows to extreme highs to result in an acceptable average. This is where the measure of Time in Range (TIR) comes in handy which is measured using data from a continuous glucose monitor (CGM) and where an ambulatory glucose profile (AGP) can be generated condensing multiple days or weeks into a 24 hour picture to pinpoint glucose variability.
Why does glucose variability matter? The higher the glucose variability the greater the risk for a severe hypoglycemic or hyperglycemic event in addition to not feeling the best when blood sugar is swinging from high to low. Most importantly, research shows that these glucose fluctuations may cause what is known as oxidative stress which is thought to be the main cause of vascular diabetic complications [1].
Keep it Simple for Me! Explanation: Oxidative stress is a chemical imbalance in the body that disturbs the equilibrium of cells’ ability to detoxify and repair damage resulting in damage to cellular components like proteins, lipids (fats), and DNA.
Nerd Alert! Explanation: Oxidative stress is an imbalance between free radicals and antioxidants in the body that results in cellular damage to DNA, proteins, and lipid containing structures, especially the cellular membrane that isolates the cell from toxins and carcinogens. A small percentage of oxygen as a byproduct of energy metabolism forms reactive free radicals. A free radical is an unstable, chemically reactive molecular fragment containing an unpaired electron that then interacts with other compounds to create new free radical molecules. Metabolic abnormalities from diabetes can result in excess free radical production. These free radicals damage electron dense components of DNA and cell membranes. Cells do possess antioxidants that chemically eradicate free radicals. However, an accumulation of free radicals causes cellular damage which is known as oxidative stress where these free radicals deteriorate cells leading to vascular damage in addition to facilitating peroxidation of LDL cholesterol leading to cytotoxicity and enhanced coronary artery plaque formation [6].
A study published in 2006 by JAMA, concluded that glucose fluctuations and swings exhibited a more specific triggering effect on oxidative stress than chronic sustained hyperglycemia (high blood sugar). This type of data suggests that a mean glucose concentration (HbA1c) alone should not be the only target but also acute glucose swings (aka time in range)[7].
Most people with type 1 and type 2 diabetes should aim for a time in range of at least 70% of readings or 17 out of 24 hours each day being in range (not too high or too low). People may have varying targets so talk with your doctor to find out what is best for you [8].
Now that you have a better understanding of Hemoglobin A1C and Time in Range, speak with your diabetes care team on what your specific goals should be and how you can reach them. If you don’t have diabetes but your friend or family member does, ask them how you can support them in meeting their diabetes goals. It may just be a matter of saving the nutrition facts on the food you are serving at your next get together 🙂
References
- Tsai, A. (2020, September/October). A1c and beyond. Diabetes Forecast, September/October 2020, 34-36.
- Mayo Clinic Staff. (2021, January 30). A1C test. Mayo Clinic. https://www.mayoclinic.org/tests-procedures/a1c-test/about/pac-20384643
- American Diabetes Association. (n.d.). Understanding a1c. American Diabetes Association. https://www.diabetes.org/a1c
- American Diabetes Association (n.d.). Complications. American Diabetes Association. https://www.diabetes.org/diabetes/complications
- Sinai Health (n.d.). Why should my a1c be 7 percent or less?. Mount Sinai Hospital. https://www.mountsinai.on.ca/care/lscd/sweet-talk-1/why-should-my-a1c-be-7-or-less
- McArdle, W.D., Katch, F.I., Katch, W.L. (2015). Exercise physiology nutrition, energy, and human performance (8th ed.). Philadelphia: Wolters Kluwer Health.
- Monnier, L., Mas, E., Ginet, C., Michel, F., Villon, L., Cristol, J.P., Colette, C. (2006 April). Activation of oxidative stress by acute glucose fluctuations compared with sustained chronic hyperglycemia in patients with type 2 diabetes. JAMA, 295(14), 1681-1687. DOI:10.1001/jama.295.14.1681
- American Diabetes Association (n.d.). CGM and time in range. American Diabetes Association. https://www.diabetes.org/healthy-living/devices-technology/cgm-time-in-range


Leave a comment